nychex provides tessellated hexagonal and and square tile maps for New York City administrative geographies. Each polygon in the source geography is represented by a single tile, arranged to approximate the overall spatial layout of the city.
Installation
You can install the development version of nychex from GitHub with:
# install.packages("pak")
pak::pak("kjhealy/nychex")
Alternatively, install this package from my r-universe:
install.packages(
  "nychex",
  repos = c("https://kjhealy.r-universe.dev", "https://cloud.r-project.org")
)
Including https://cloud.r-project.org ensures dependencies on CRAN are resolved automatically.
NTA-level Hex Tiles and Outlines
library(ggplot2)
library(nychex)

ggplot(nyc_nta20_hex_sf) +
  geom_sf(aes(fill = boro_name), color = "white", linewidth = 0.3) +
  scale_fill_brewer(palette = "Set2") +
  labs(fill = "Borough") +
  theme_void()
ggplot(nyc_nta20_hex_sf) +
  geom_sf(aes(fill = boro_name), color = "white", linewidth = 0.3) +
  geom_sf_text(aes(label = nta_abbrev), size = 1.8) +
  scale_fill_brewer(palette = "Set2") +
  labs(fill = "Borough") +
  theme_void()
Borough outlines are also available via nyc_nta_boros_hex_sf, with separate outlines for Brooklyn and Queens:
ggplot() +
  geom_sf(
    data = nyc_nta20_hex_sf,
    aes(fill = boro_name),
    color = "white",
    linewidth = 0.2,
    alpha = 0.3
  ) +
  geom_sf(
    data = nyc_nta_boros_hex_sf,
    aes(color = boro_name),
    fill = NA,
    linewidth = 0.8
  ) +
  scale_fill_brewer(palette = "Set2") +
  scale_color_brewer(palette = "Set2") +
  labs(fill = "Borough", color = "Borough") +
  theme_void()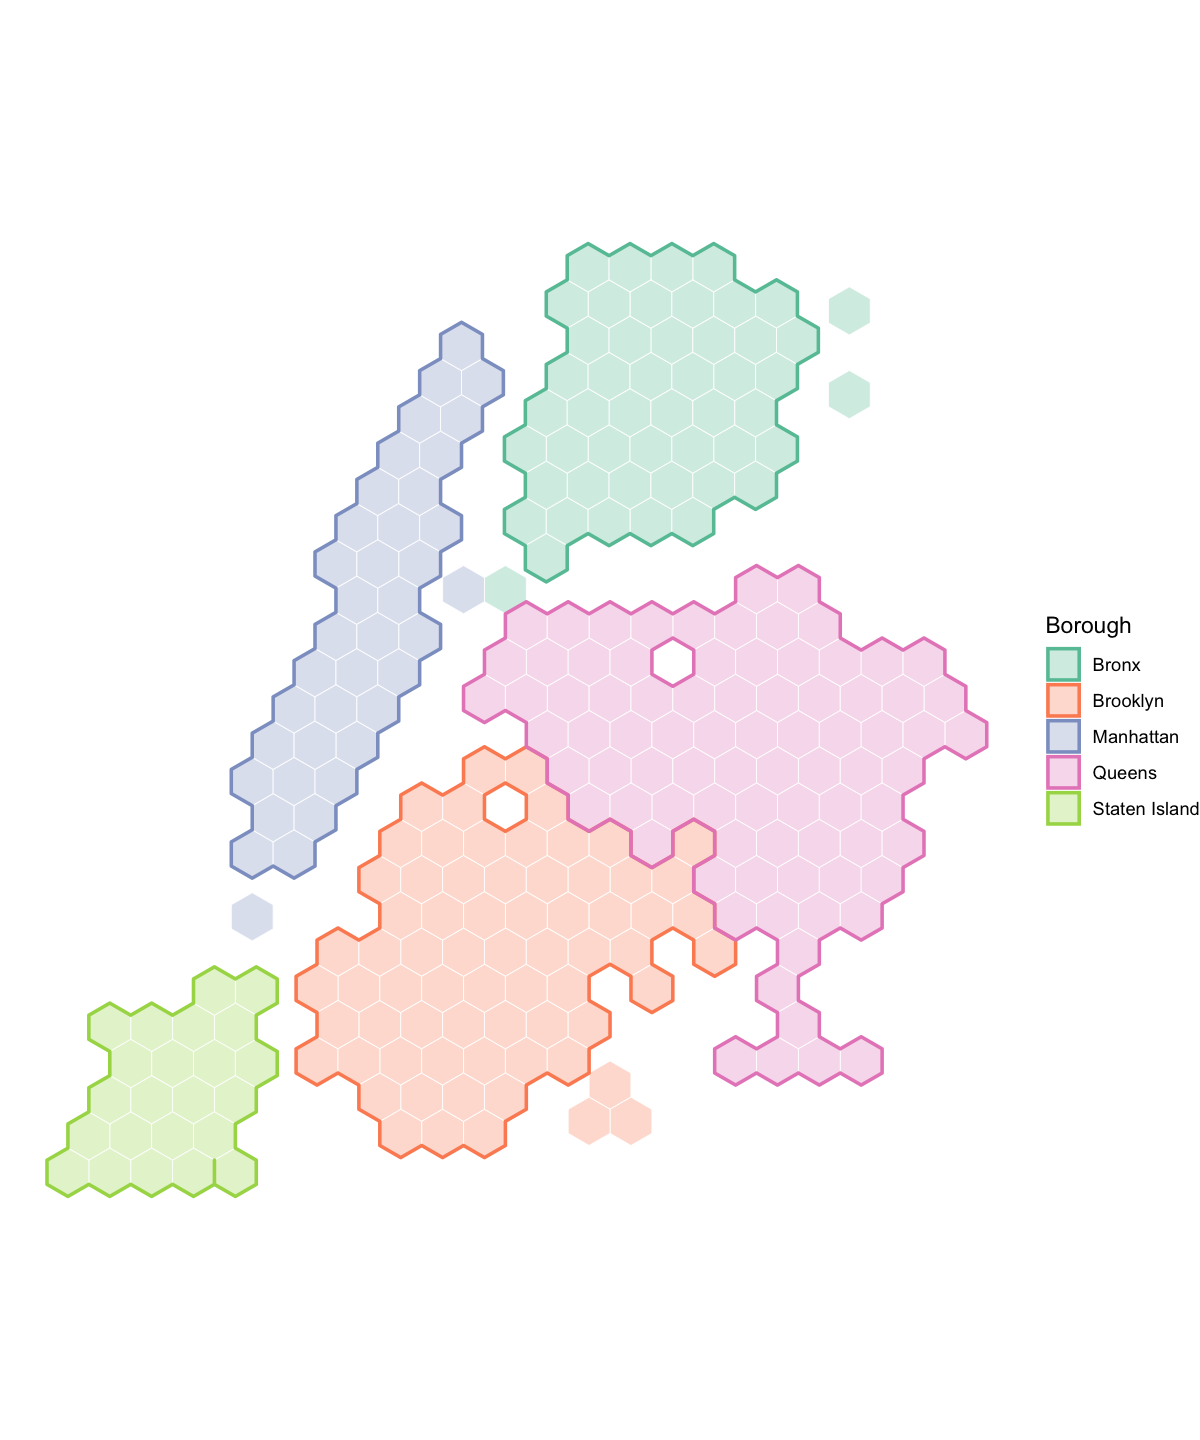
Tract-level Hex Tiles and Outlines
A census tract level hex map is also available via nyc_ct20_hex_sf (2,325 tracts), with its own borough outlines in nyc_ct_boros_hex_sf:
ggplot(nyc_ct20_hex_sf) +
  geom_sf(aes(fill = boro_name), color = "white", linewidth = 0.1) +
  scale_fill_brewer(palette = "Set2") +
  labs(fill = "Borough") +
  theme_void()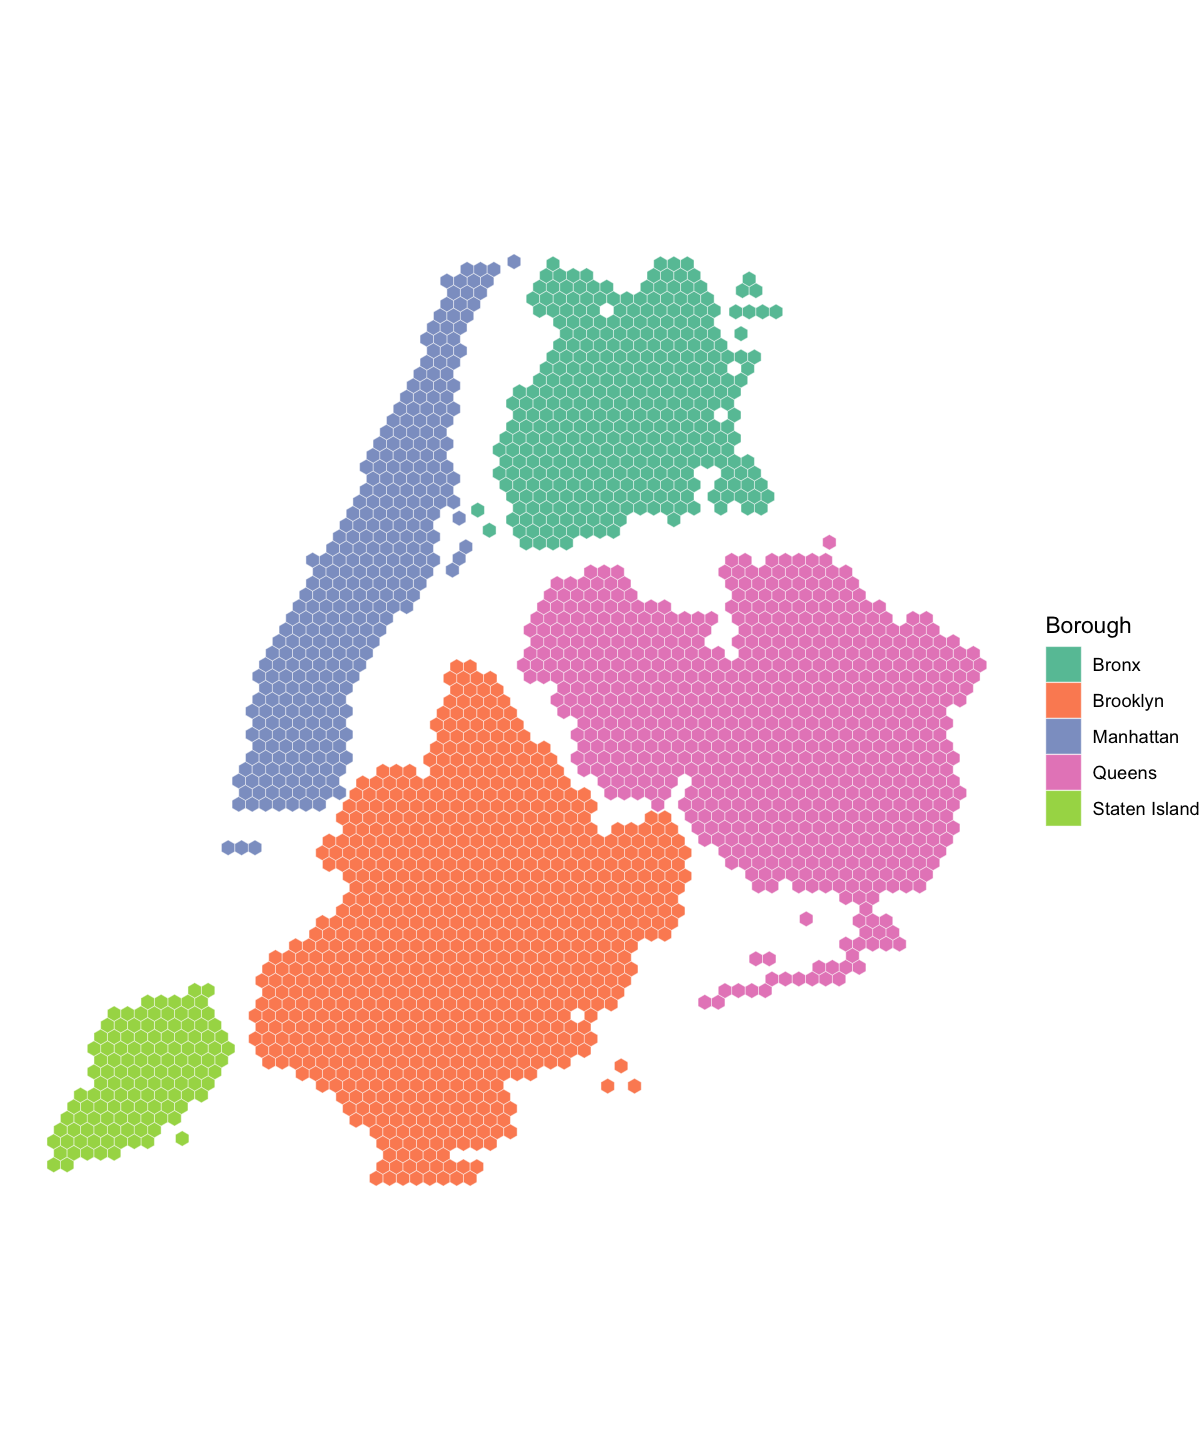
ggplot() +
  geom_sf(
    data = nyc_ct20_hex_sf,
    aes(fill = boro_name),
    color = "white",
    linewidth = 0.2,
    alpha = 0.3
  ) +
  geom_sf(
    data = nyc_ct_boros_hex_sf,
    aes(color = boro_name),
    fill = NA,
    linewidth = 0.8
  ) +
  scale_fill_brewer(palette = "Set2") +
  scale_color_brewer(palette = "Set2") +
  labs(fill = "Borough", color = "Borough") +
  theme_void()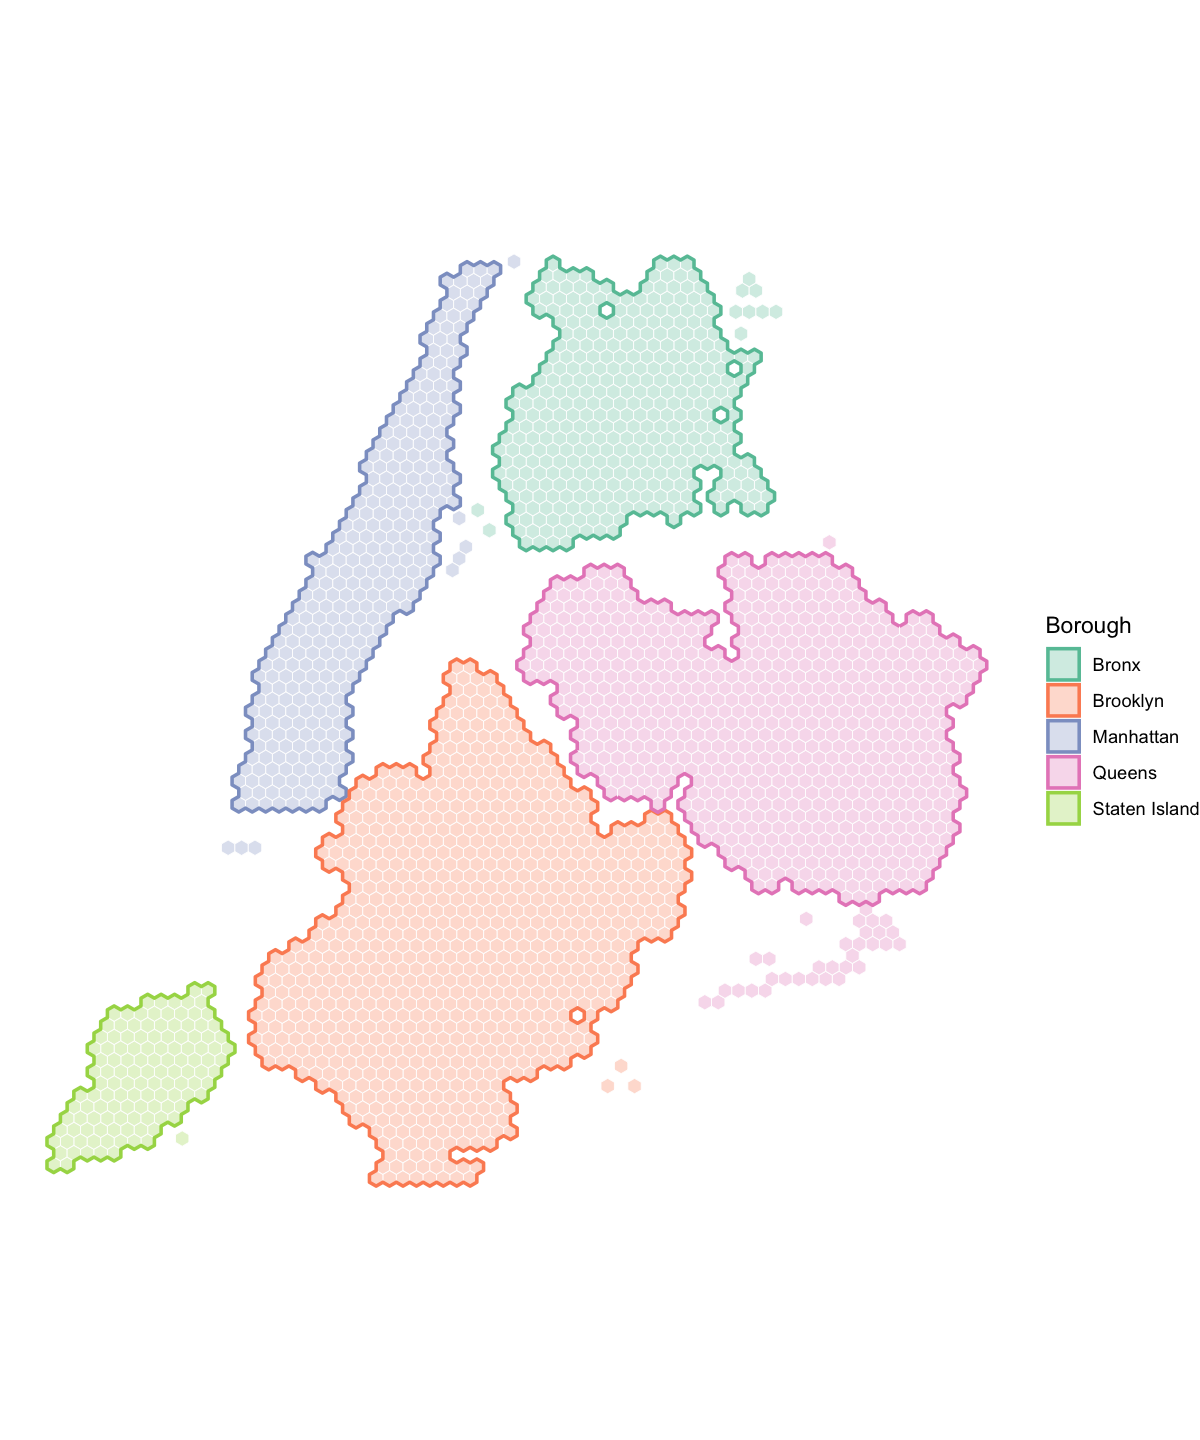
NTA-level Square Tiles
A square tile variant is available via nyc_nta20_sq_sf:
ggplot(nyc_nta20_sq_sf) +
  geom_sf(aes(fill = boro_name), color = "white", linewidth = 0.3) +
  scale_fill_brewer(palette = "Set2") +
  labs(fill = "Borough") +
  theme_void()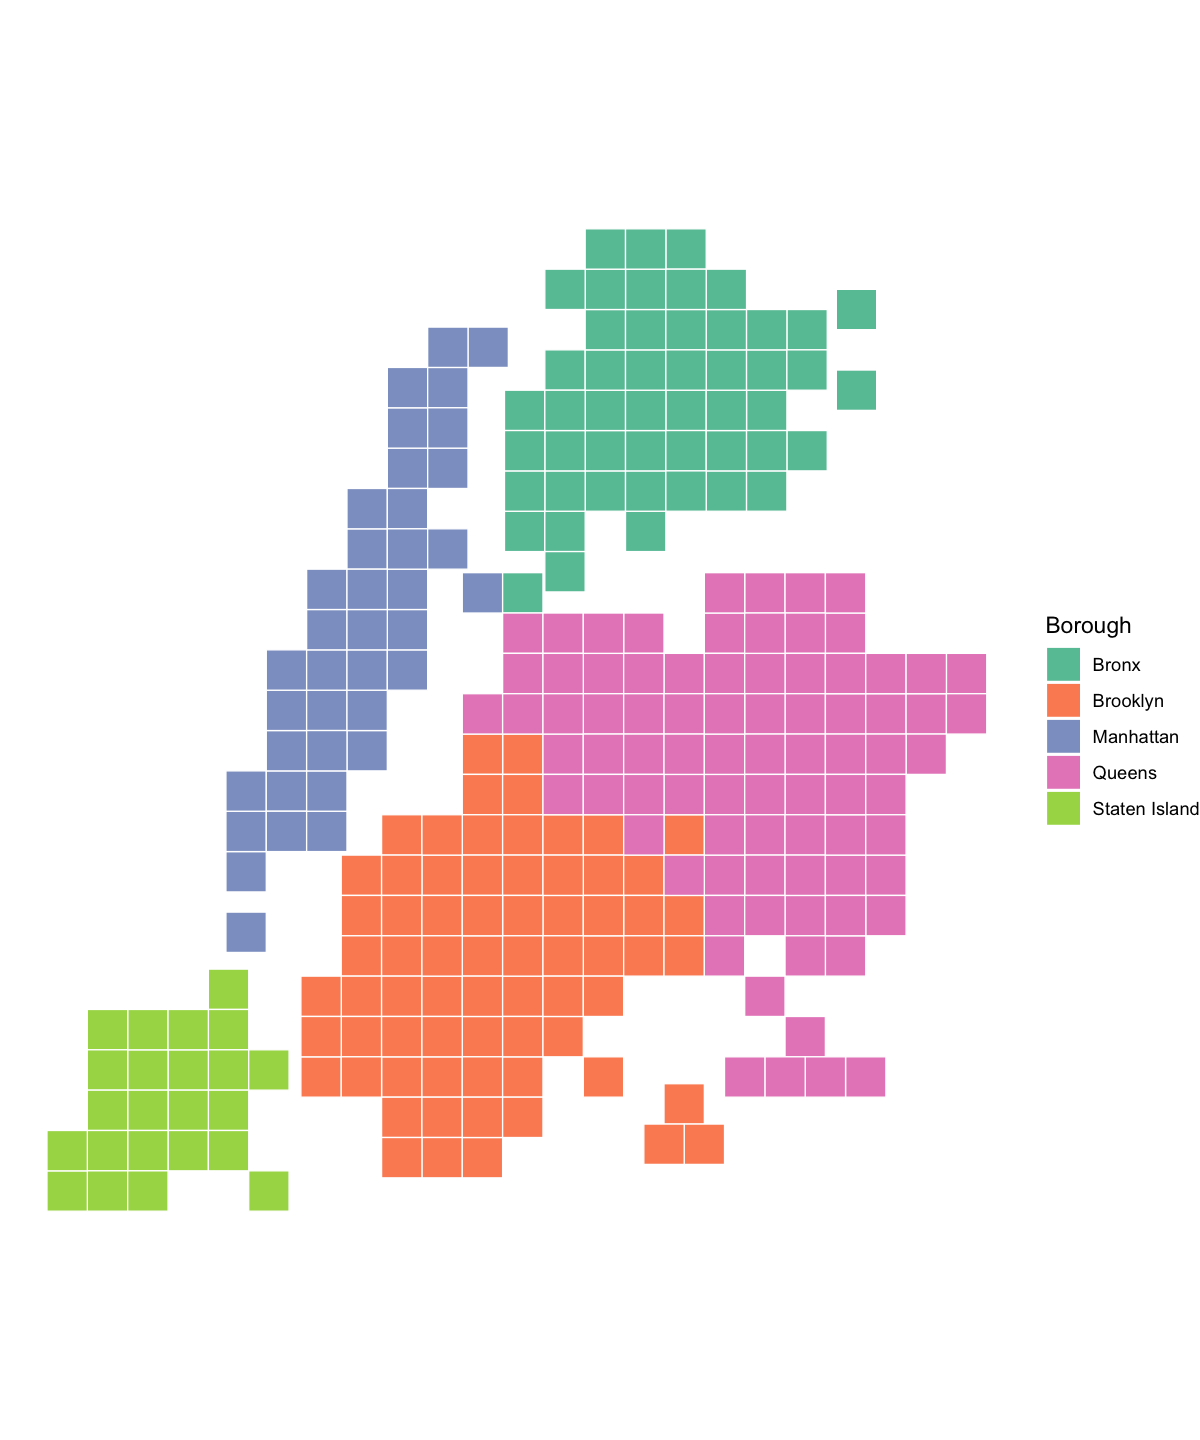
Borough outlines for the square map are available via nyc_nta_boros_sq_sf:
ggplot() +
  geom_sf(
    data = nyc_nta20_sq_sf,
    aes(fill = boro_name),
    color = "white",
    linewidth = 0.2,
    alpha = 0.3
  ) +
  geom_sf(
    data = nyc_nta_boros_sq_sf,
    aes(color = boro_name),
    fill = NA,
    linewidth = 0.8
  ) +
  scale_fill_brewer(palette = "Set2") +
  scale_color_brewer(palette = "Set2") +
  labs(fill = "Borough", color = "Borough") +
  theme_void()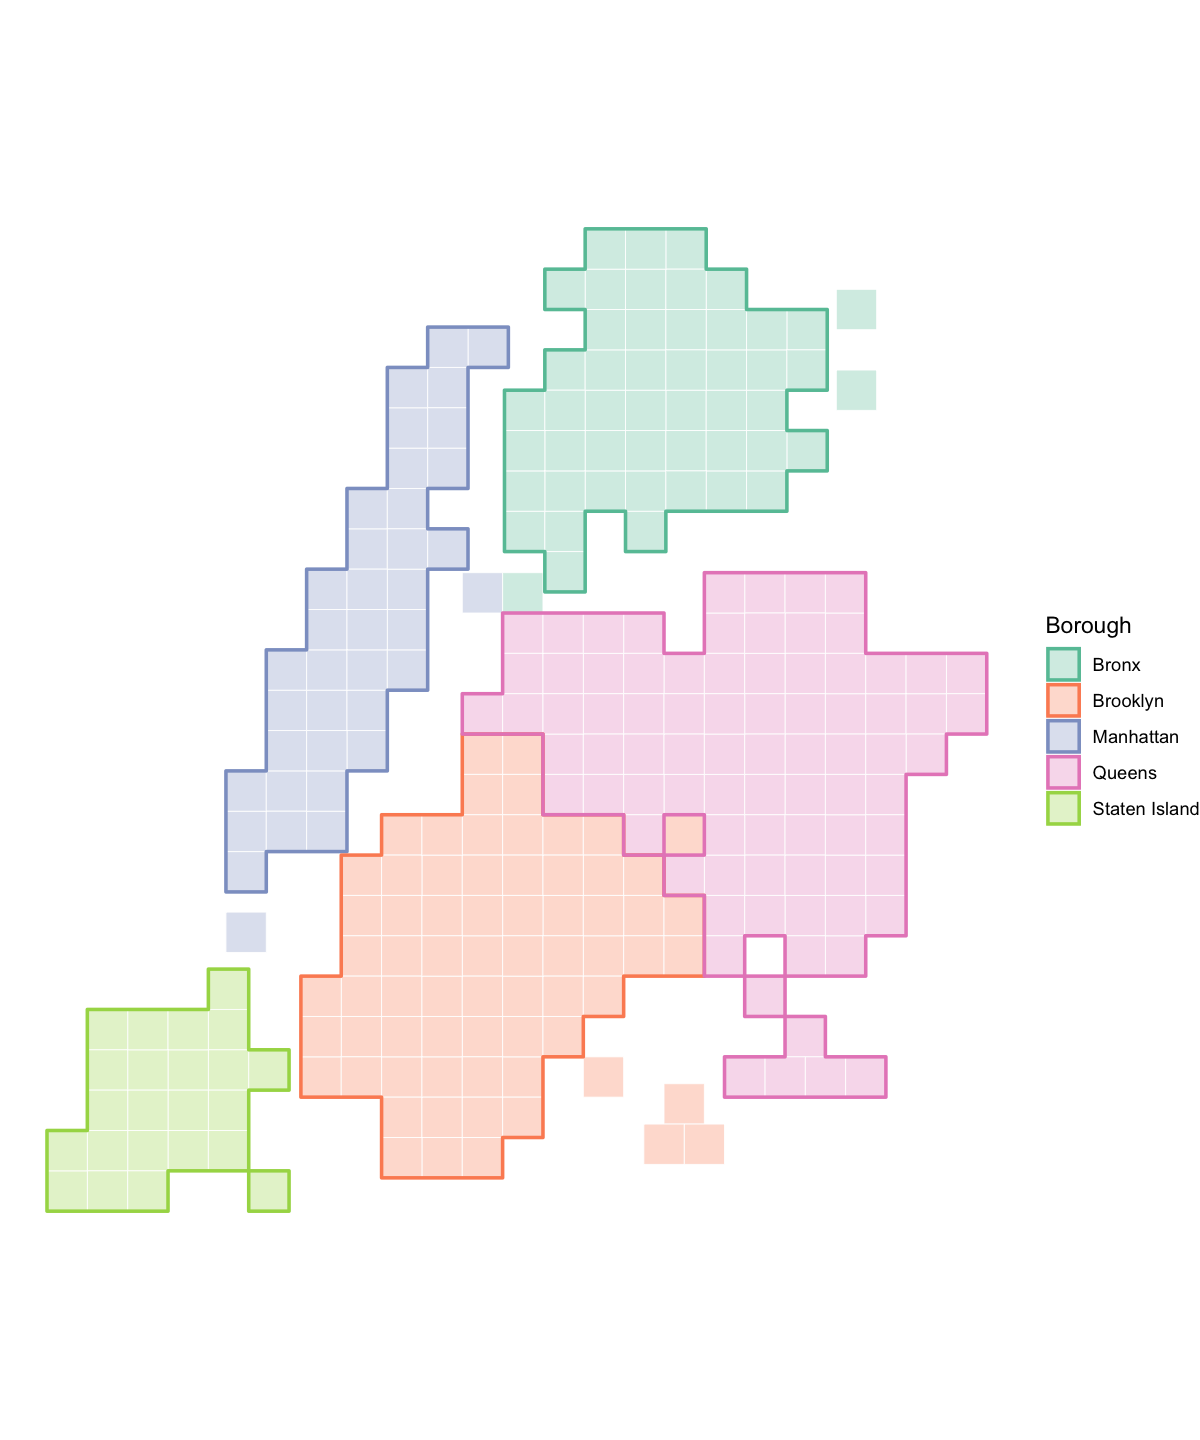
Tract-level Square Tiles
Census tract level square tile maps are available via nyc_ct20_sq_sf (2,325 tracts), with borough outlines in nyc_ct_boros_sq_sf:
ggplot(nyc_ct20_sq_sf) +
  geom_sf(aes(fill = boro_name), color = "white", linewidth = 0.1) +
  scale_fill_brewer(palette = "Set2") +
  labs(fill = "Borough") +
  theme_void()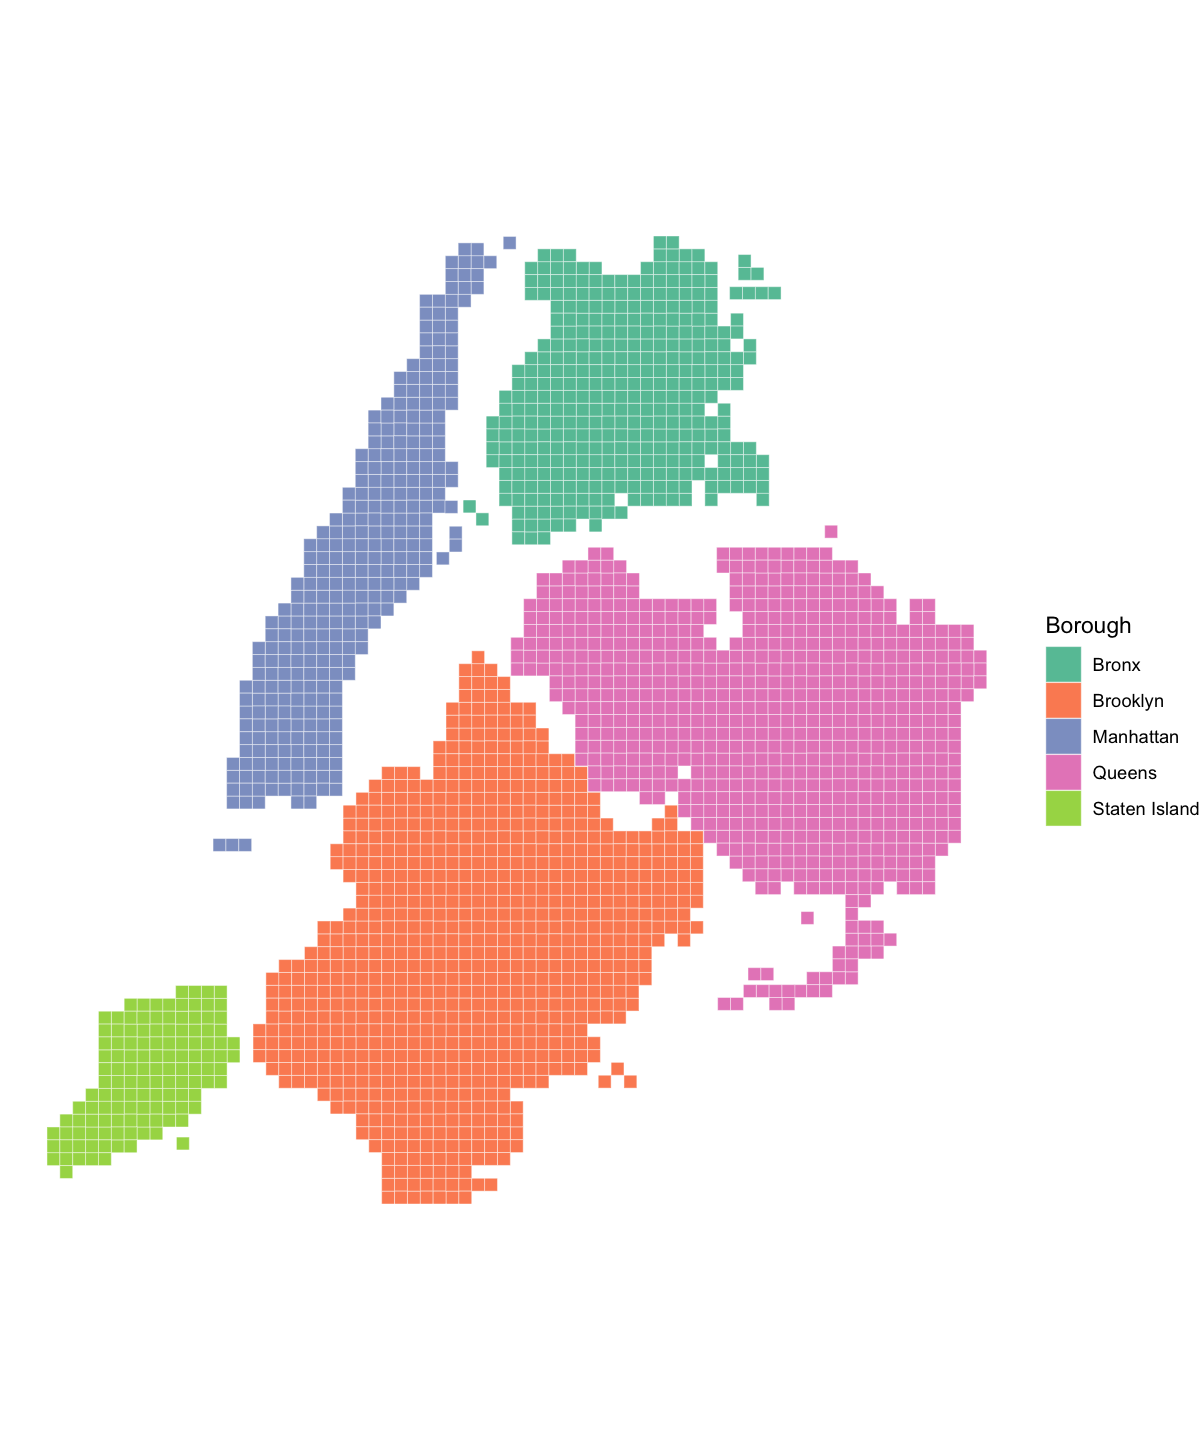
ggplot() +
  geom_sf(
    data = nyc_ct20_sq_sf,
    aes(fill = boro_name),
    color = "white",
    linewidth = 0.2,
    alpha = 0.3
  ) +
  geom_sf(
    data = nyc_ct_boros_sq_sf,
    aes(color = boro_name),
    fill = NA,
    linewidth = 0.8
  ) +
  scale_fill_brewer(palette = "Set2") +
  scale_color_brewer(palette = "Set2") +
  labs(fill = "Borough", color = "Borough") +
  theme_void()