Installation
nycdogs is a data package. Install the package from GitHub with:
# install.packages("pak")
pak::pak("kjhealy/nycdogs")
Alternatively, install it from my r-universe:
install.packages(
  "nycdogs",
  repos = c("https://kjhealy.r-universe.dev", "https://cloud.r-project.org")
)
Including https://cloud.r-project.org ensures dependencies on CRAN are resolved automatically.
The nycdogs package contains two datasets, nyc_license and nyc_bites. They contain, respectively, data on all licensed dogs in New York city (current), and data on reported dog bites in New York city (older data). It also re-exports objects from nyczips to make it easier to draw maps of the data.
Loading the data
The package works best with the tidyverse libraries and the simple features package for mapping.
library(tidyverse)
#> ── Attaching core tidyverse packages ──────────────────────── tidyverse 2.0.0 ──
#> ✔ dplyr     1.2.1     ✔ readr     2.2.0
#> ✔ forcats   1.0.1     ✔ stringr   1.6.0
#> ✔ ggplot2   4.0.2     ✔ tibble    3.3.1
#> ✔ lubridate 1.9.5     ✔ tidyr     1.3.2
#> ✔ purrr     1.2.1
#> ── Conflicts ────────────────────────────────────────── tidyverse_conflicts() ──
#> ✖ dplyr::filter() masks stats::filter()
#> ✖ dplyr::lag()    masks stats::lag()
#> ℹ Use the conflicted package (<http://conflicted.r-lib.org/>) to force all conflicts to become errors
library(sf)
#> Linking to GEOS 3.13.0, GDAL 3.8.5, PROJ 9.5.1; sf_use_s2() is TRUE
Load the data:
To look at the tibble that contains the licensing data, do this:
nyc_license
#> # A tibble: 722,864 × 12
#>    animal_name animal_gender animal_birth_year breed_name      breed_rc zip_code
#>    <chr>       <chr>                     <int> <chr>           <chr>    <chr>
#>  1 Paige       F                          2014 American Pit B… Pit Bul… 10035
#>  2 Yogi        M                          2010 Boxer           Boxer    10465
#>  3 Ali         M                          2014 Basenji         Basenji  10013
#>  4 Queen       F                          2013 Akita Crossbre… Akita C… 10013
#>  5 Lola        F                          2009 Maltese         Maltese  10028
#>  6 Ian         M                          2006 Unknown         Unknown  10013
#>  7 Buddy       M                          2008 Unknown         Unknown  10025
#>  8 Chewbacca   F                          2012 Labrador Retri… Labrado… 10013
#>  9 Heidi-bo    F                          2007 Dachshund Smoo… Dachshu… 11215
#> 10 Massimo     M                          2009 Bull Dog, Fren… Bull Do… 11201
#> # ℹ 722,854 more rows
#> # ℹ 6 more variables: zip <chr>, license_issued_date <date>,
#> #   license_expired_date <date>, extract_year <int>, borough <chr>, city <chr>
Example
Where dogs with a particular name live:
boro_names <- c("Manhattan", "Queens", "Brooklyn",
                "Bronx", "Staten Island")

nyc_coco <- nyc_license |>
  filter(borough %in% boro_names) |>
  group_by(zip, animal_name) |>
  tally() |>
  ungroup() |>
  complete(zip, animal_name,
           fill = list(n = 0)) |>
  filter(animal_name == "Coco") |>
  mutate(freq = n / sum(n),
           pct = round(freq*100, 2))


nyc_coco
#> # A tibble: 196 × 5
#>    zip   animal_name     n     freq   pct
#>    <chr> <chr>       <int>    <dbl> <dbl>
#>  1 10001 Coco           52 0.00960   0.96
#>  2 10002 Coco           61 0.0113    1.13
#>  3 10003 Coco           22 0.00406   0.41
#>  4 10004 Coco            2 0.000369  0.04
#>  5 10005 Coco            5 0.000923  0.09
#>  6 10006 Coco            0 0         0
#>  7 10007 Coco           25 0.00462   0.46
#>  8 10009 Coco           50 0.00923   0.92
#>  9 10010 Coco           57 0.0105    1.05
#> 10 10011 Coco           58 0.0107    1.07
#> # ℹ 186 more rows

## nyc_zip_sf is from the nyczips package, which is automatically loaded by nycdogs.
coco_map <- left_join(nyc_zip_sf, nyc_coco)
#> Joining with `by = join_by(zip)`

## Map theme
theme_nymap <- function(base_size=9, base_family="") {
    require(grid)
    theme_bw(base_size=base_size, base_family=base_family) %+replace%
        theme(axis.line=element_blank(),
              axis.text=element_blank(),
              axis.ticks=element_blank(),
              axis.title=element_blank(),
              panel.background=element_blank(),
              panel.border=element_blank(),
              panel.grid=element_blank(),
              panel.spacing=unit(0, "lines"),
              plot.background=element_blank(),
              legend.justification = c(0,0),
              legend.position = "inside",
              legend.position.inside = c(0, 0.7),
              legend.direction = "horizontal"
        )
}

coco_map |> ggplot(mapping = aes(fill = pct)) +
    geom_sf(color = "gray80", linewidth = 0.1) +
    scale_fill_binned(guide = "bins", type = "viridis", option = "A") +
    labs(fill = "Percent of all NYC\ndogs named Coco") +
  annotate(geom = "text", x = -74.16, y = 40.84,
           label = "Where's Coco?", size = 6) +
    theme_nymap()
#> Loading required package: grid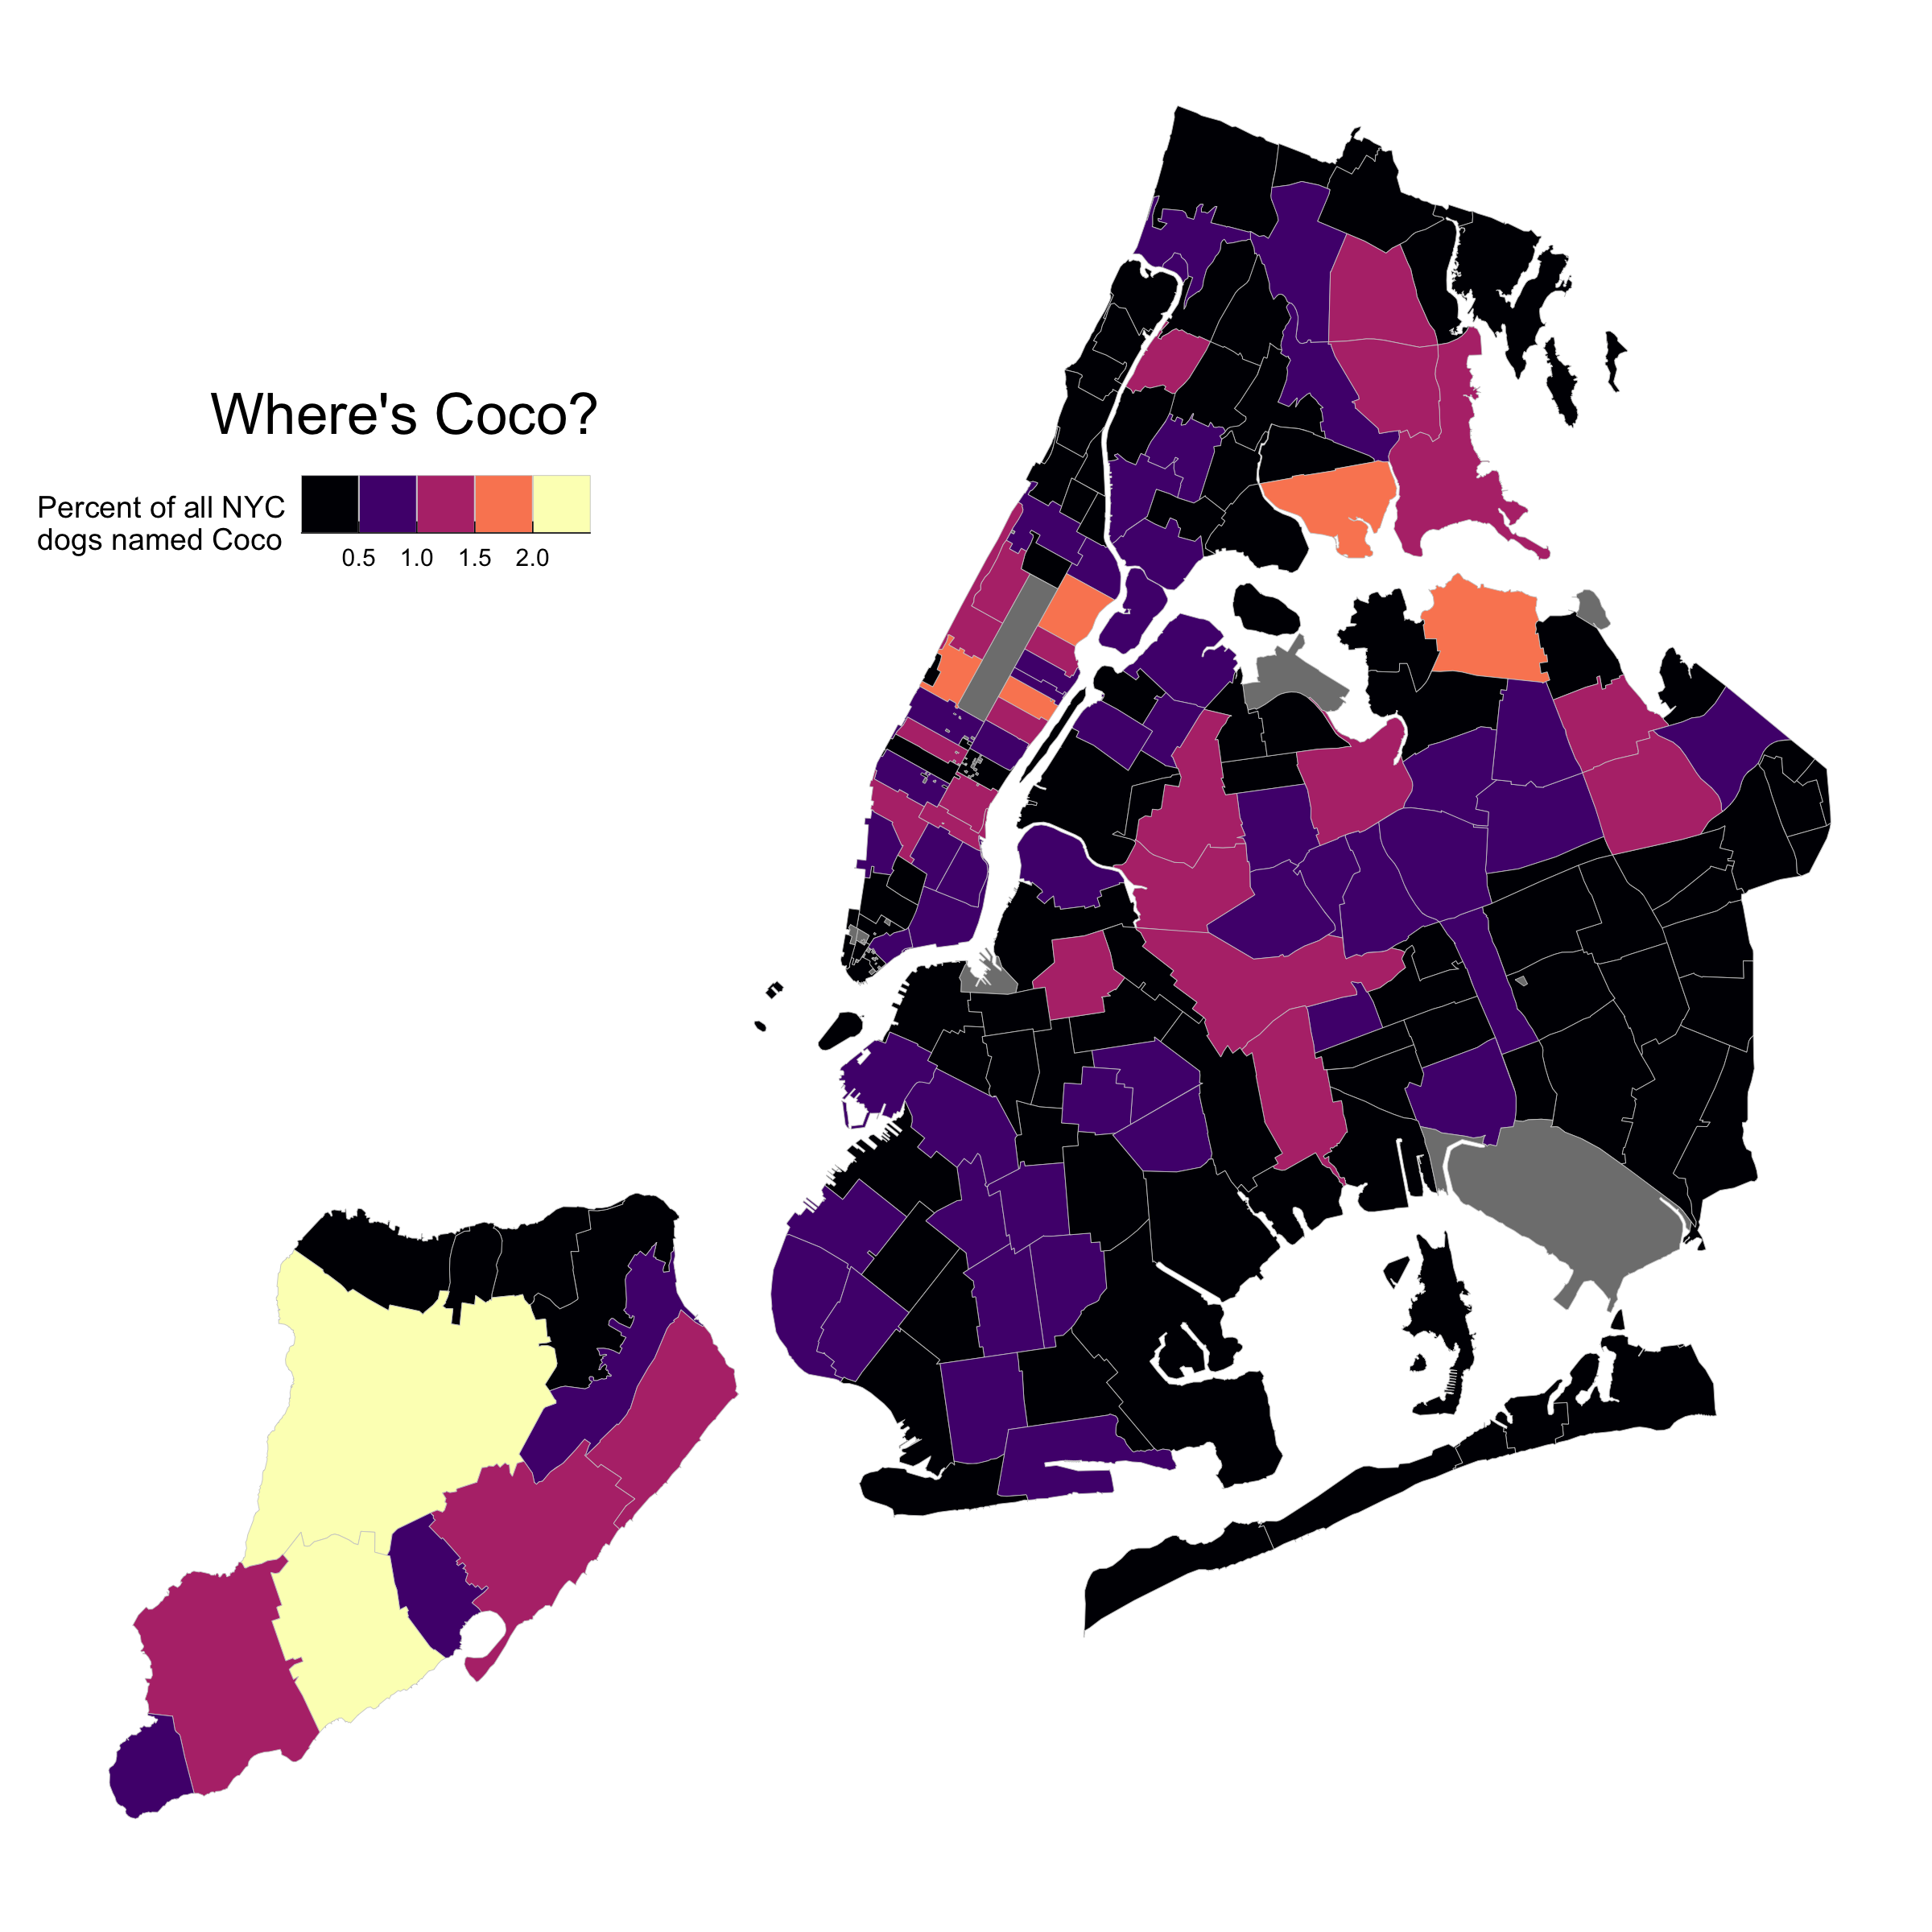
Hex photo: Detail from Elliott Erwitt, “New York City, 1974”.