Plot a table of color hex values as a table of colors
Examples
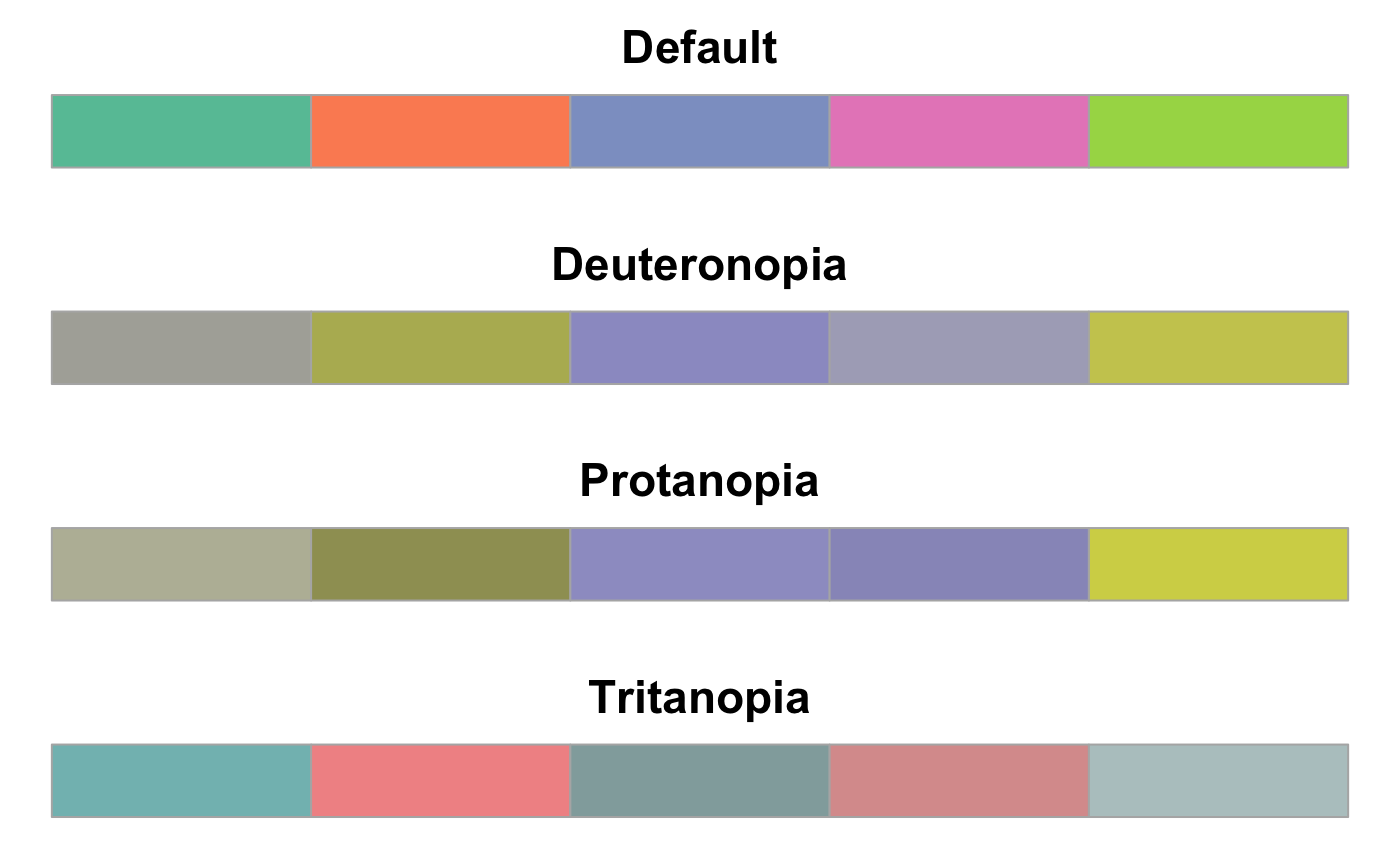
color_table
#> # A tibble: 5 × 4
#>   Default Deuteronopia Protanopia Tritanopia
#>   <chr>   <chr>        <chr>      <chr>
#> 1 #66C2A5 #AEAEA7      #BABAA5    #82BDBD
#> 2 #FC8D62 #B6B661      #9E9E63    #F29494
#> 3 #8DA0CB #9C9CCB      #9E9ECB    #92ABAB
#> 4 #E78AC3 #ACACC1      #9898C3    #DA9C9C
#> 5 #A6D854 #CACA5E      #D3D355    #B6C8C8
color_comp(color_table)